...
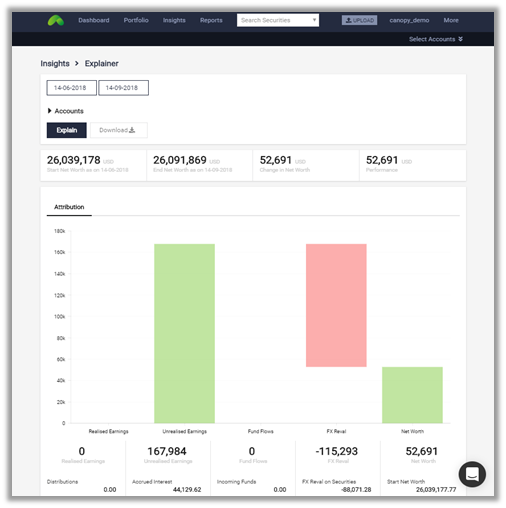
Canopy's performance attribution module is termed the Explainer. It details where money was made or lost, specifically in realized earnings, unrealized earnings, fund flows and FX revaluations.
Within each category you can further drill down individual factor. The relevant securities are shown as line items in a list below that you can easily sort based on market value
To find out more about the Explainer methodology, please see here: The Explainer explained.
Security
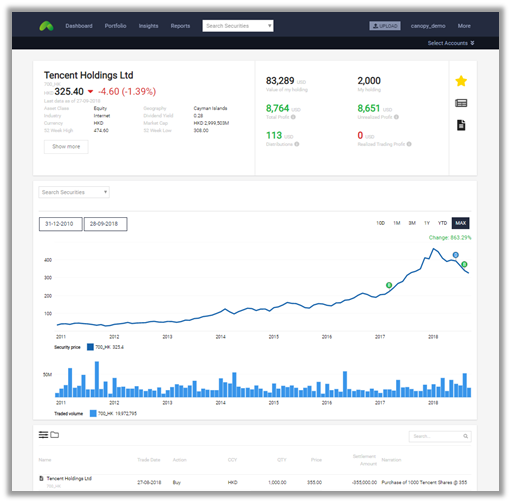
Each individual security page shows the full history, across all accounts that hold the security, of when the security was bought or sold, when dividends and coupons were paid, the current value and P/L of the aggregated position, and more.
All transaction activities such as buy, sell and dividend or coupon payment history are shown as individual line items and displayed in a list.
Holdings
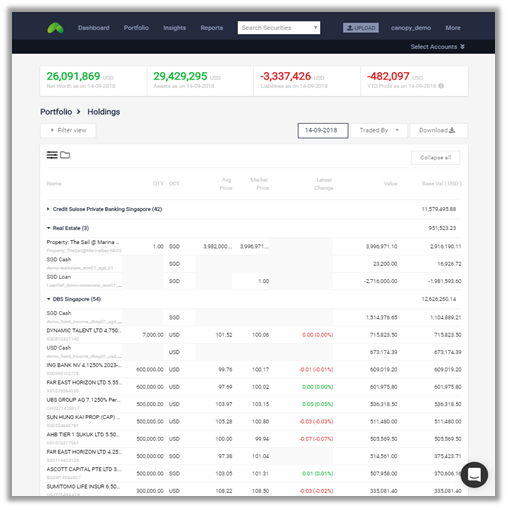
This page shows all positions you hold as of any chosen date. It lists all of your holdings by category of your choice (default is by custodian bank).
For analysis, you may easily slice and dice data using the smart filter function. Alternatively, all data can also be downloaded into excel.
Transactions
...


