Canopy Visualizer
The Canopy Visualizer is your main interface for your daily portfolio monitoring. Canopy gives you the ability to perform portfolio analysis, view asset allocations, predict future cash flows, conduct account comparisons and much more.
Dashboard
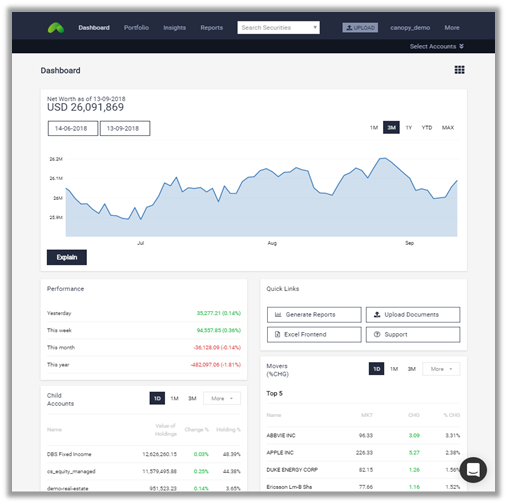
Upon logging into Canopy, you will be greeted by the Dashboard. The Dashboard provides an overview of the user’s portfolio at a glance; such as net worth, today's performance today and the top movers in the portfolio.
The Net Worth chart is interactive. You may select the time period for analysis by highlighting sections of the graph to explain the change in movement.
You may also select the accounts on which you wish to perform analysis from the 'Select Accounts' drop-down at the top righthand corner.
Asset Allocation
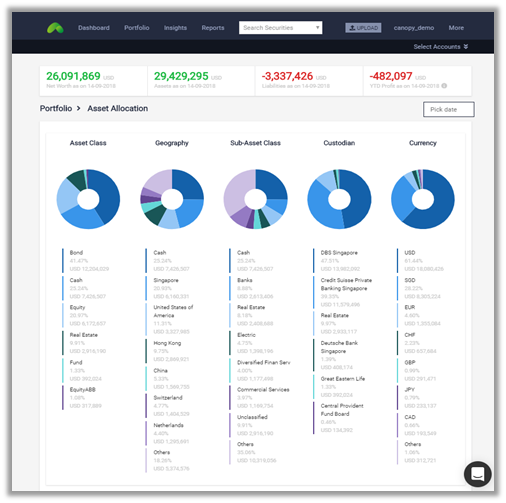
The Allocation page shows your asset allocation by five categories: Asset Class, Geography, Industry, Custodian and Currency.
Performance
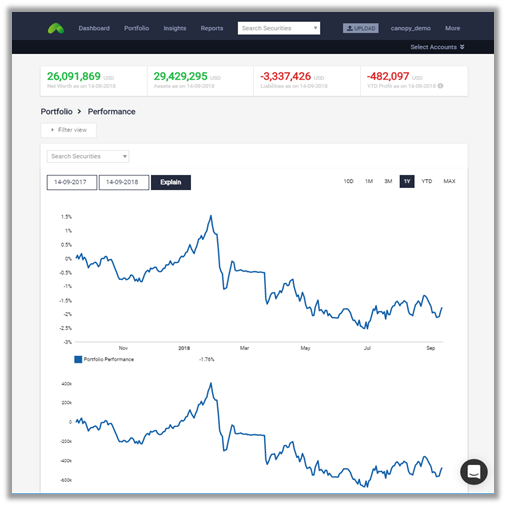
The Performance page displays performance from two perspective - time-weighted return and absolute profit.
You may compare the performance of your portfolio against relevant benchmarks or between your respective accounts.
It is also possible to create sub-portfolios in which you can group assets and accounts to suit your analysis.
Explainer
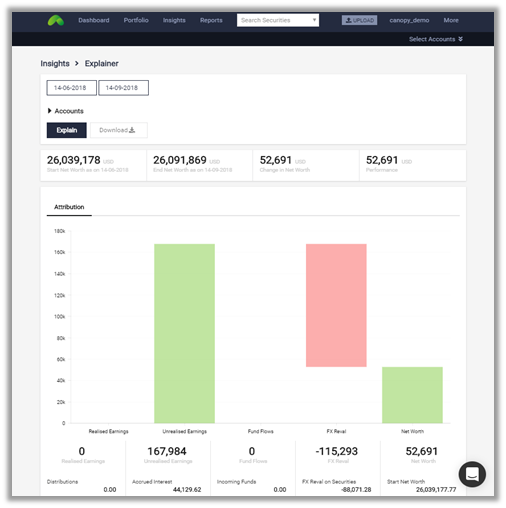
Canopy's performance attribution module is termed the Explainer. It details where money was made or lost, specifically in realized earnings, unrealized earnings, fund flows and FX revaluations.
Within each category you can further drill down individual factor. The relevant securities are shown as line items in a list below that you can easily sort based on market value
To find out more about the Explainer methodology, please see here: The Explainer explained.
Security
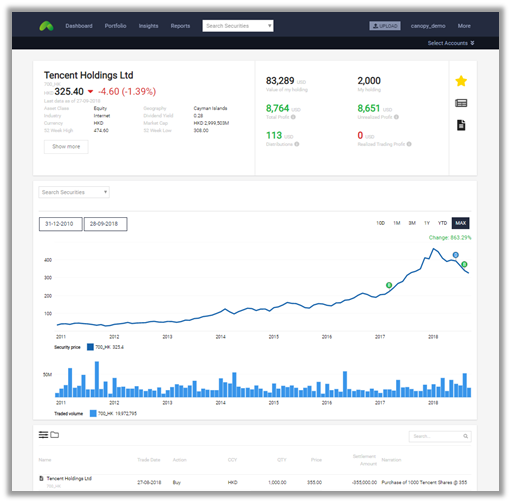
Each individual security page shows the full history, across all accounts that hold the security, of when the security was bought or sold, when dividends and coupons were paid, the current value and P/L of the aggregated position, and more.
All transaction activities such as buy, sell and dividend or coupon payment history are shown as individual line items and displayed in a list.
Holdings
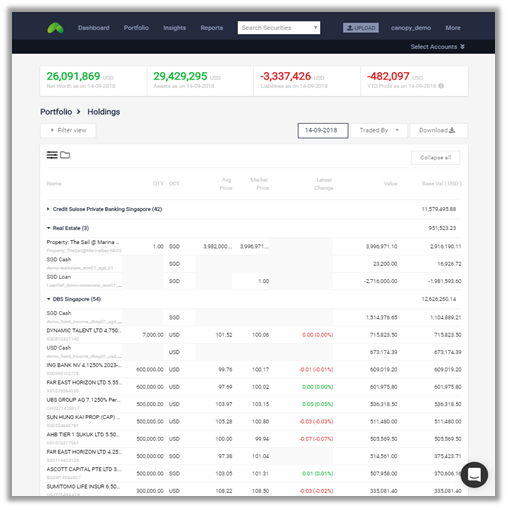
This page shows all positions you hold as of any chosen date. It lists all of your holdings by category of your choice (default is by custodian bank).
For analysis, you may easily slice and dice data using the smart filter function. Alternatively, all data can also be downloaded into excel.
Transactions
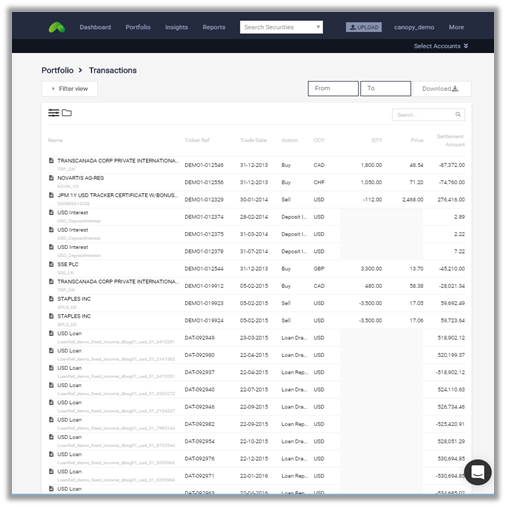
The Transactions page is the master list of every line item extracted from your statements. Making use of the comprehensive smart filter allows you to quickly extract the transactions of relevance to your analysis.
Analytics
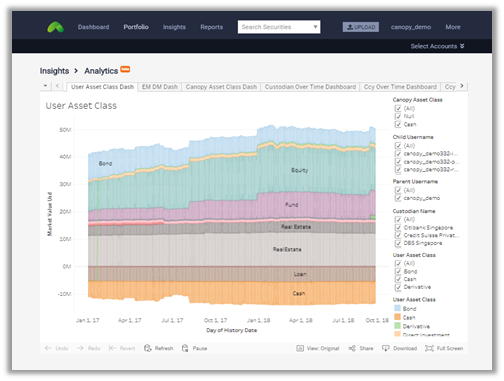
The Analytics page offers maximum flexibility in portfolio analysis with rich visualizations of financial data. You can explore pre-defined reports including cash flows generated, XIRR/profit, transaction volume by account etc.
Unique dashboards can be created for specific analysis. Best of all, all charts can be inserted as high resolution graphics into presentations and emails, saving you time to recreate them.
Key Metrics
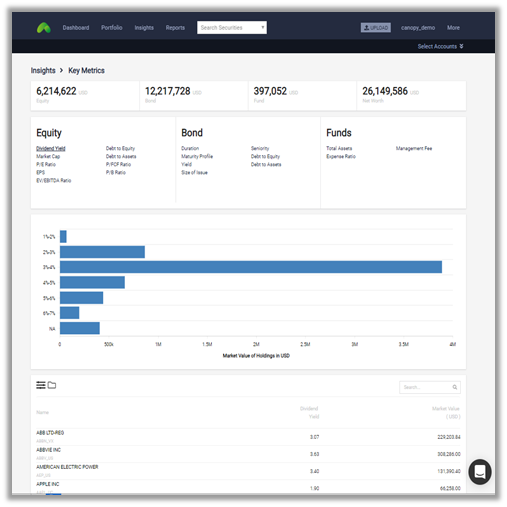
The Key Metrics page offers a targeted approach at performing your analysis with various financial metrics.
For instance, P/E ratio, dividend yield, EPS for equities and maturity profile, credit ratings and yield for bonds.
You can click through each chart element to drill down to the list of securities belonging to that bucket, and further drill down to the individual security level from the list.
Cashflows
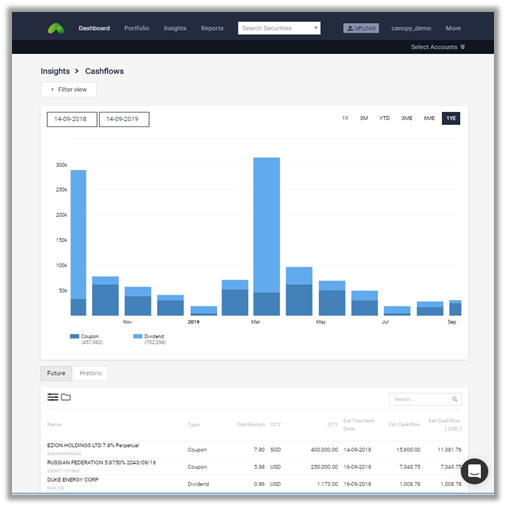 =
=The Cashflows report is a pro-forma projection of your cashflows from coupons and dividends based on your current bond and equity holdings. The distribution details are obtained from Bloomberg and updated on a quarterly basis. It gives you a good proxy of your future dividend income and carry return.
Should you have any questions on any features, please do not hesitate to chat with us through the chat function at the bottom right corner of the screen.