Canopy Reports
- Philipp Klein (Unlicensed)
- Cyrus DM (Unlicensed)
- Eryn Wu (Unlicensed)
Canopy prides itself in its excellent reporting capabilities and allows users to generate reports easily from the expanding reports repository. We offer 3 different categories of reports, namely:
Standard PDF Reports
Reports can be downloaded from Visualizer under Reports > Generate Reports. Below is a list of the report types that are currently available:
| Report Title | Description | Sample |
|---|---|---|
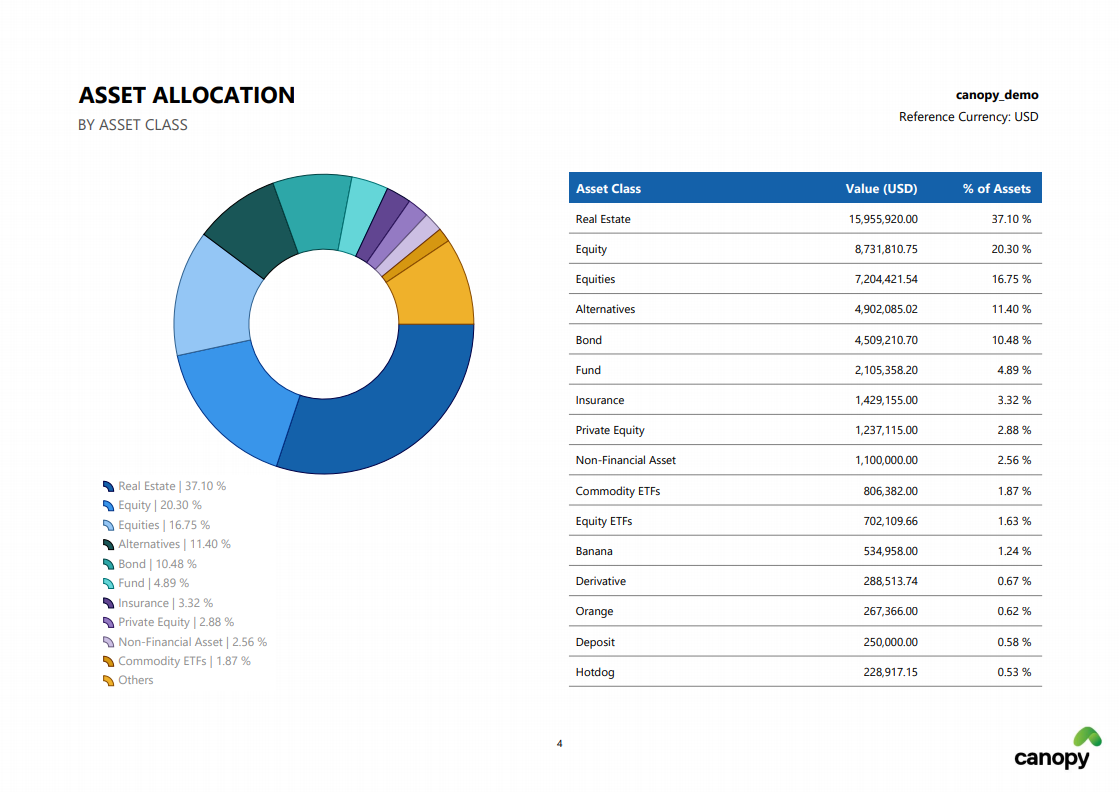
| Asset Allocation - Doughnut Charts | The Asset Allocation report is based on the "Report Date As Of" and shows asset allocation by asset class, currency, geography, industry as well as networth by custodian. Contents:
| |
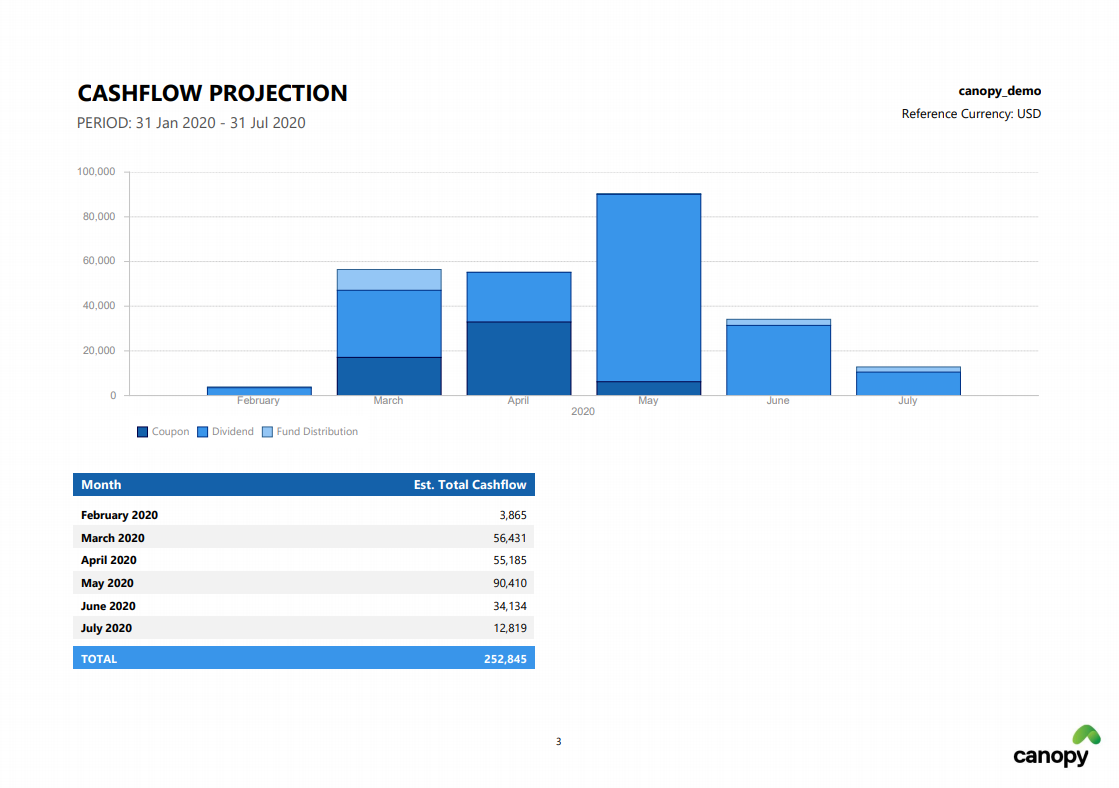
| Cashflows | The Cashflows report is based on the respective input parameters "Cashflows From/To". It shows a summary for all cashflows during the selected period divided into cashflow types on a monthly basis. It also includes a full list of all cashflows organized by type and currency. Contents:
| |
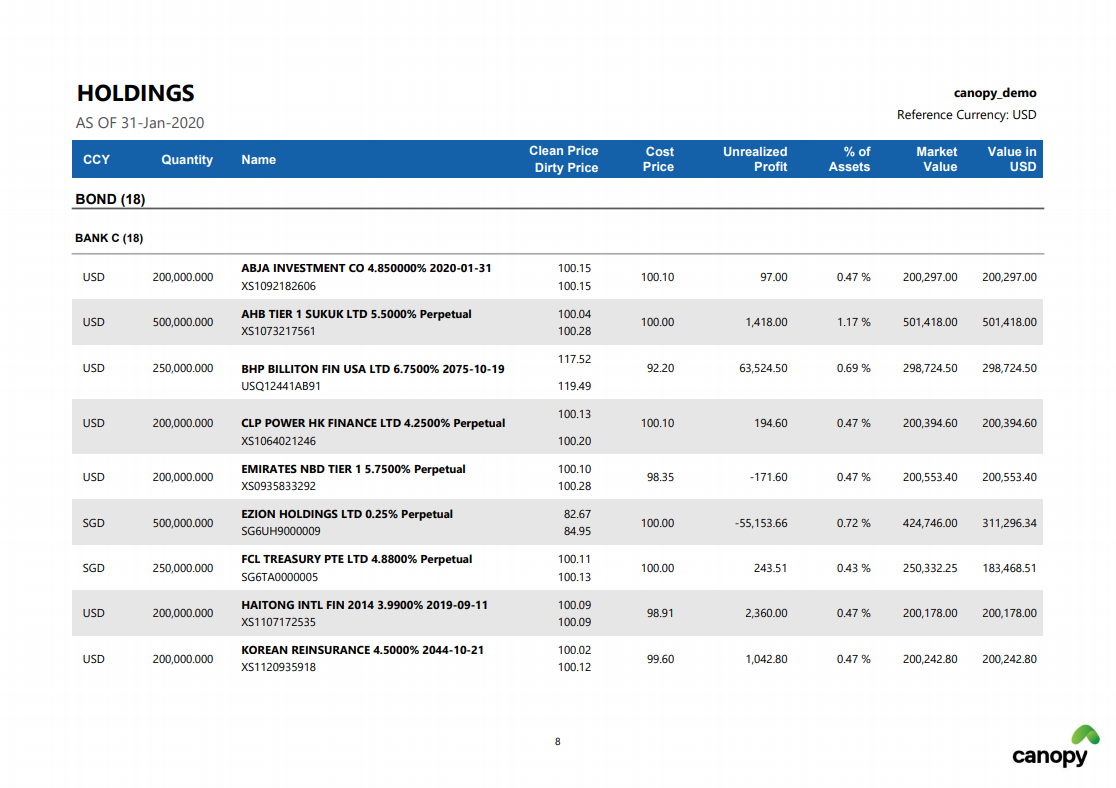
| Holdings | The Portfolio Holdings report is based on the "Report Date As Of" shows all holdings organized by currency and asset class. Contents:
| |
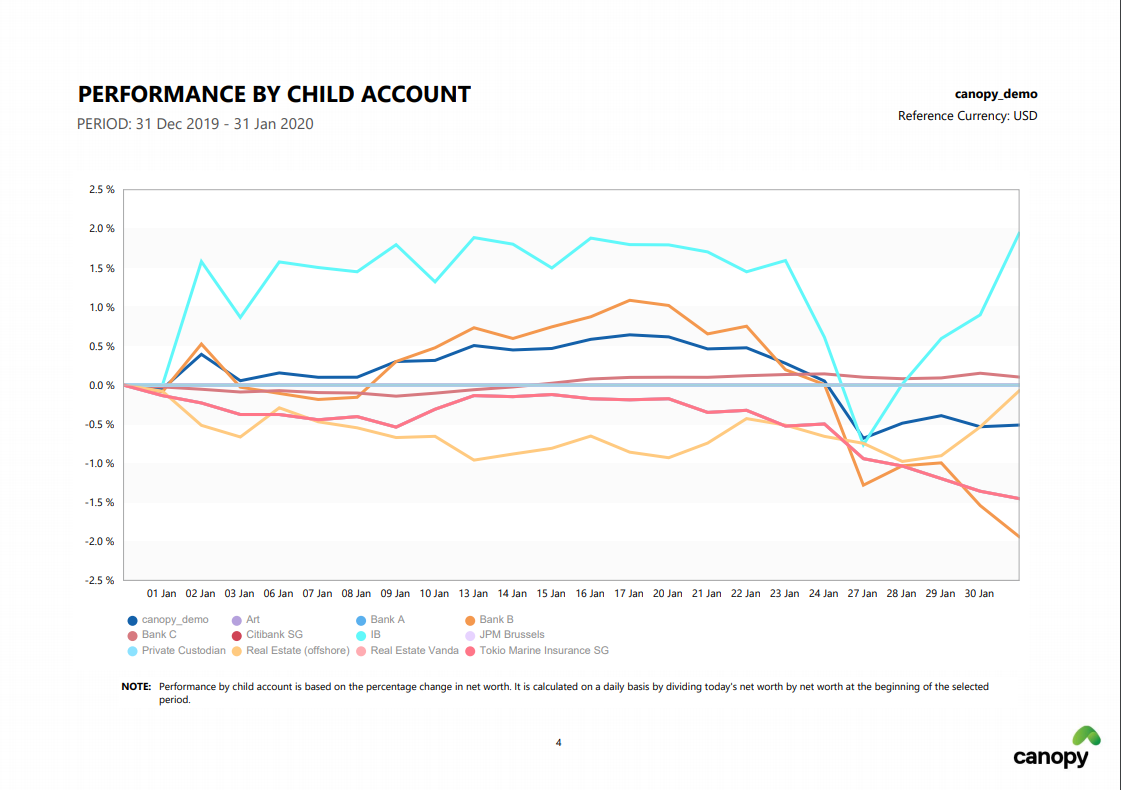
| Performance | Performance is based on the respective input parameters "Performance Date From/To" shows the performance of the overall account in comparison to selected benchmarks and by child accounts and asset classes. Contents:
| |
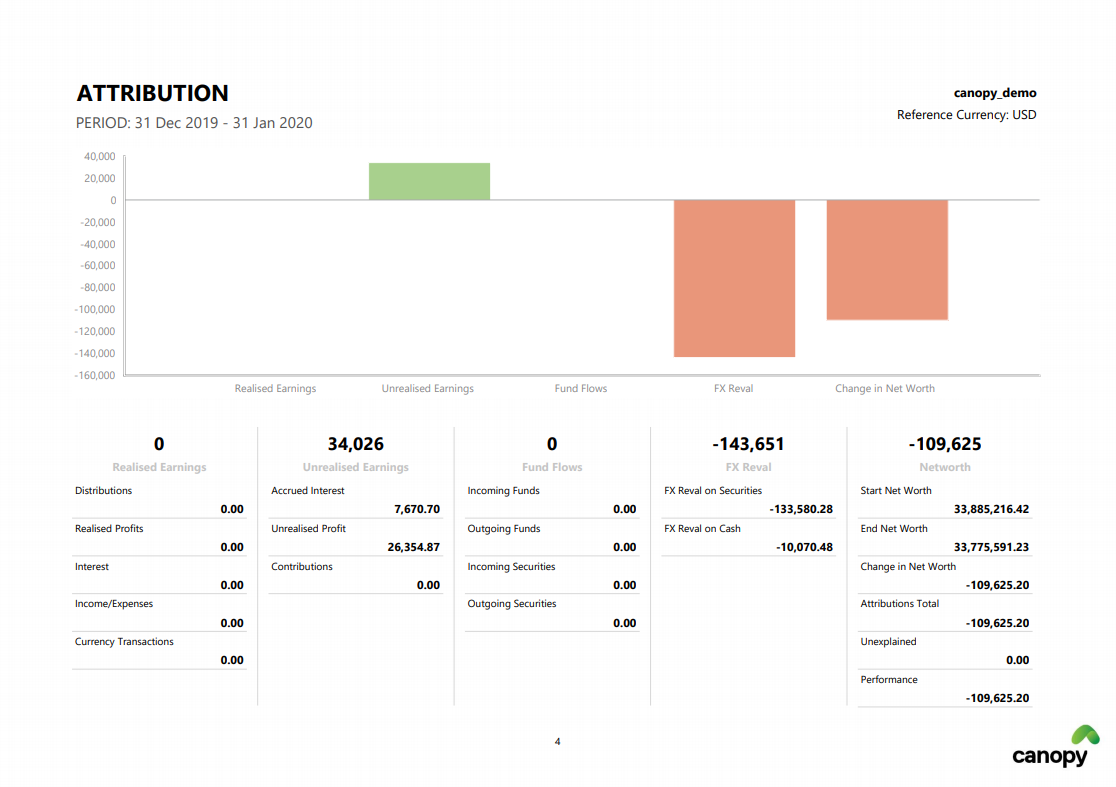
| Performance Attribution | The Performance Attribution report is based on the respective input parameters "Performance Date From/To" shows the performance of the overall account together with performance attribution similar to the Explainer in the Canopy Visualizer. Contents:
| |
| Portfolio Summary with Transactions - Bar Charts | The Portfolio Summary includes asset allocation, performance, holdings and transactions. Asset allocations and holdings are based on the "Report Date As Of" while performance and transactions are based on respective input parameters "Performance Date From/To" and "Transactions Date From/To". Contents:
|
Analytics Reports
Analytics reports can be accessed from the Analytics tab on visualizer.
| Report Title | Description | Sample |
|---|---|---|
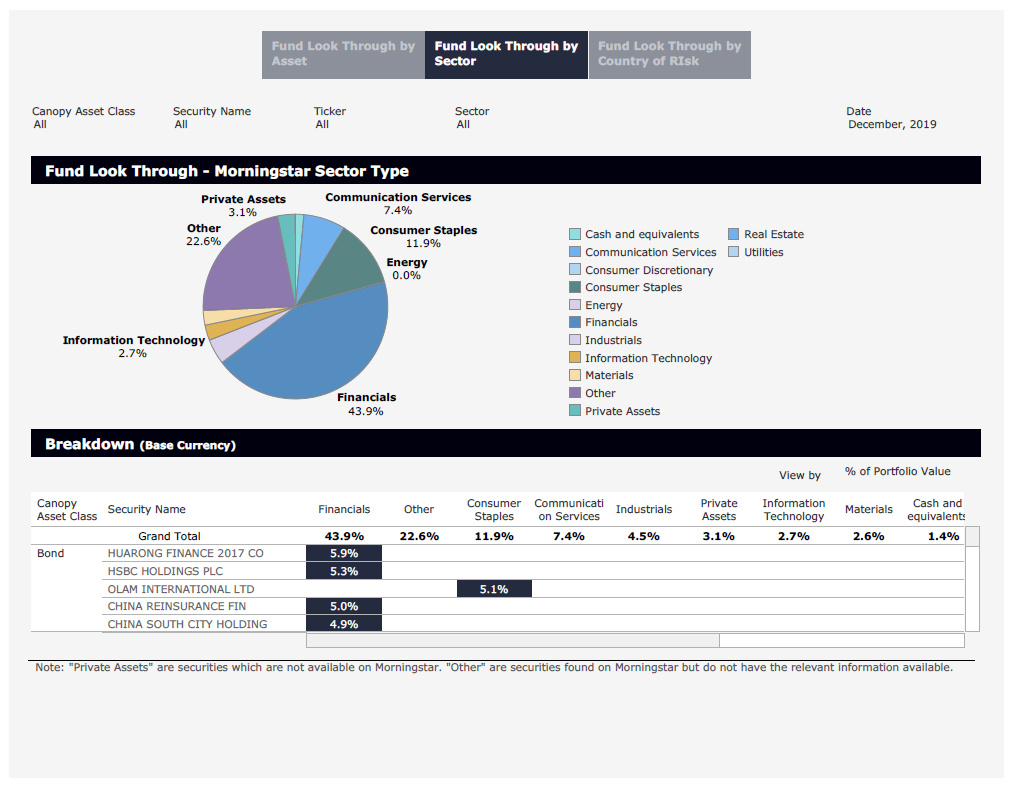
| Analytics Report | Portfolio
Fund Look Through
Insights (Peer Analysis)
Performance
|
Special Reports
| Report Title | Description | Sample |
|---|---|---|
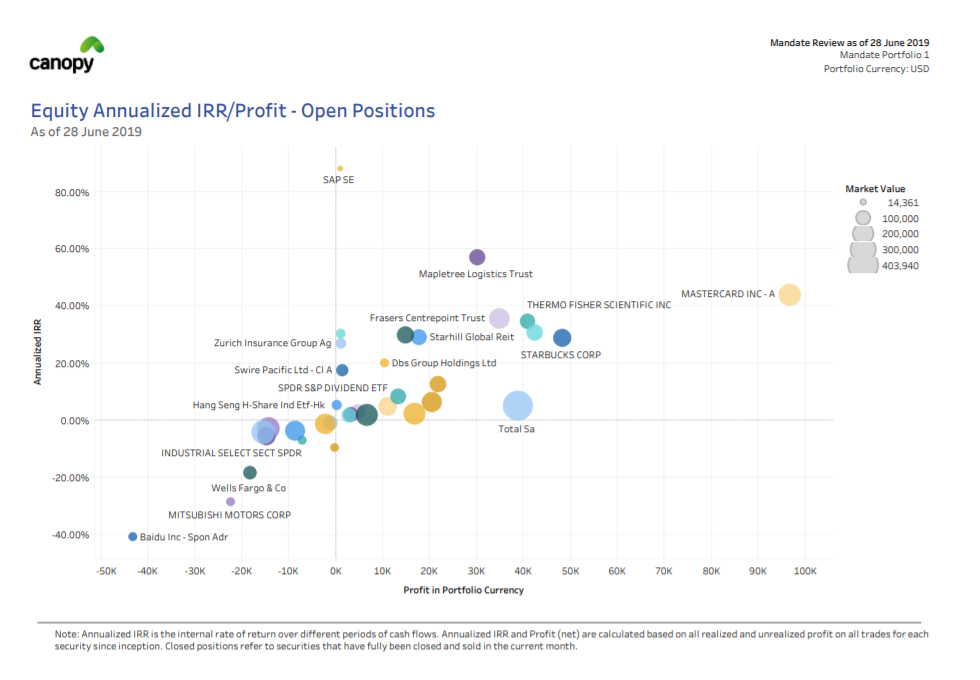
| Mandate Report Can be downloaded under Documents tab on Visualizer | The Mandate Report is a monthly report designed to provide insights into the Mandate Portfolio. Contents:
| |
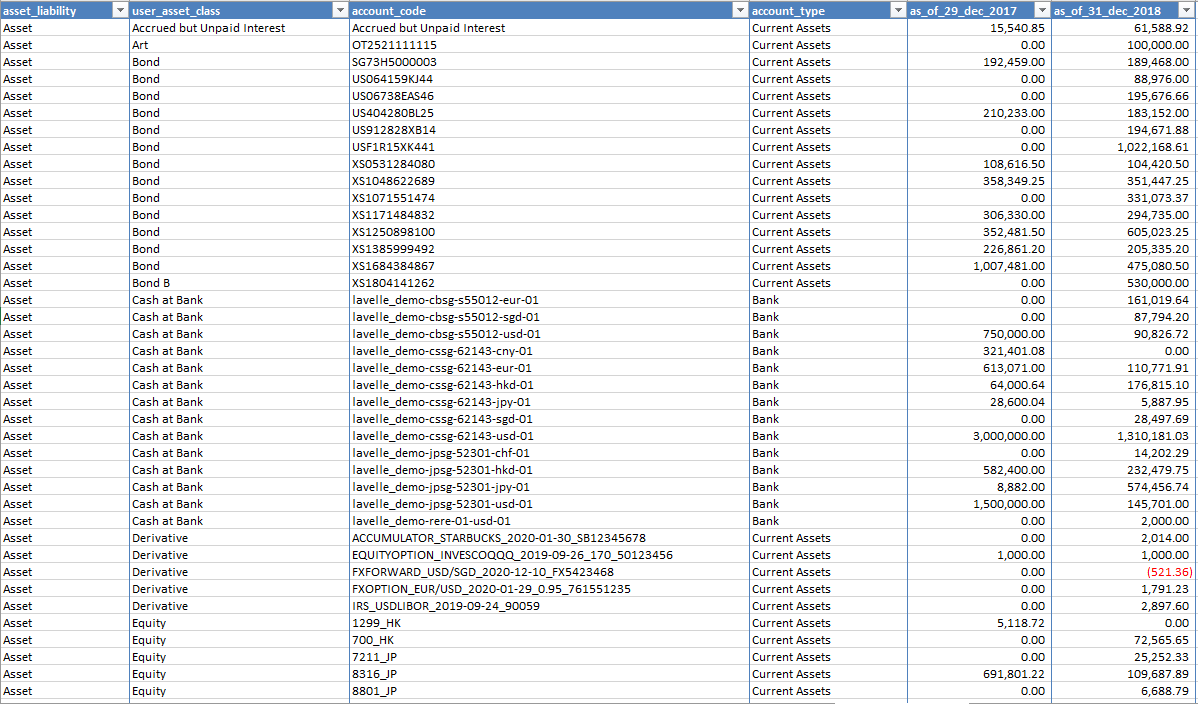
Financial Statement (Suitable for Tax Reporting) Available upon Request | The Financial Statement provides the below contents and could be used by tax advisors to facilitate tax reporting. Contents:
| |
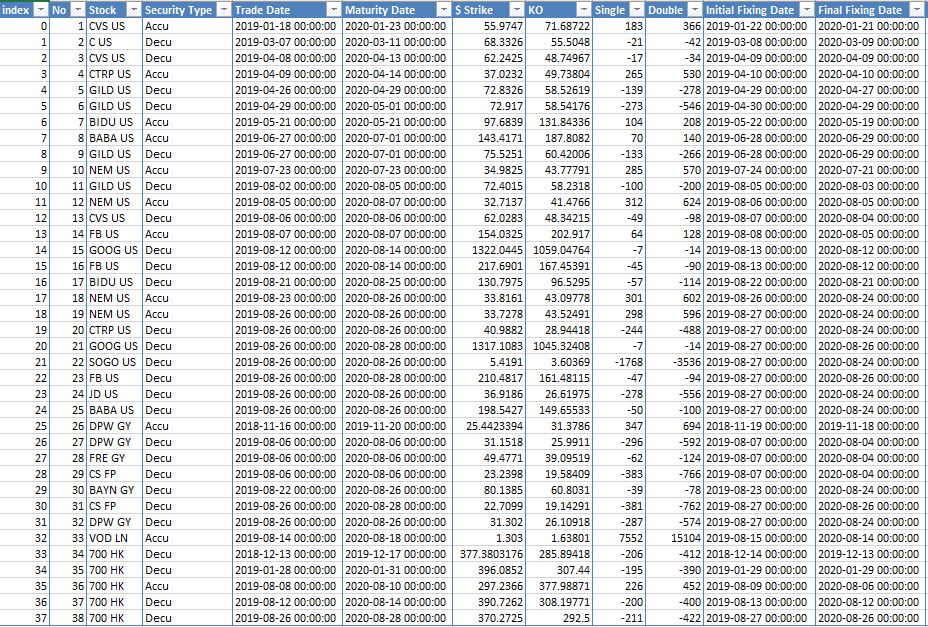
Structured Products Report | The Structured Products Report provides the below contents. Contents:
|