Canopy Analytics
Introduction
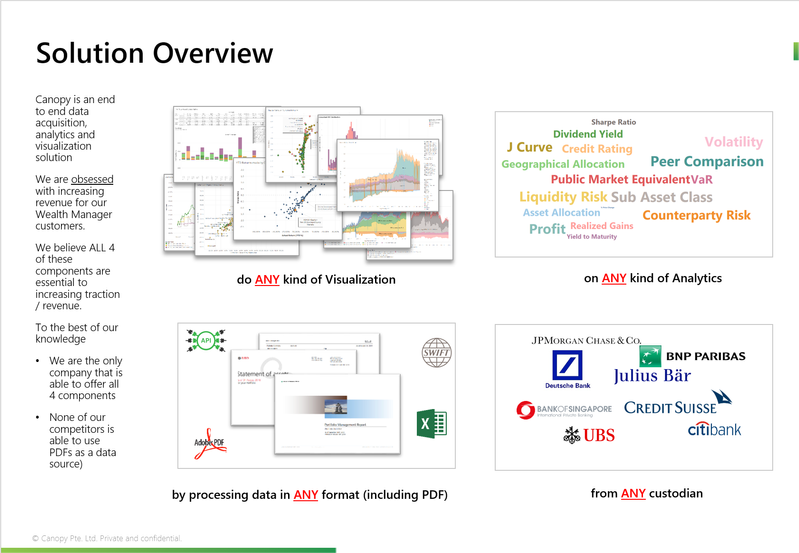
Access richer visualizations of wealth data with flexibility:
- Slice and dice your portfolio by account, custodian, asset class and security
- Interactive charts packed with related transactions information
- Explore ready-made reports including cash flows generated, XIRR/profit, transaction volume (by account) and many more
- Create your very own dashboard to present your ideas (optional)
- Download relevant charts or the full report with ease
An introduction demo video is here
Using Analytics
- Please select the tabs at the top of the charts to view different charts.
- You can download either the current sheet or the whole document with all the different analytics tabs into one A4 PDF document.
Dashboards
Canopy Analytics Dashboards are 'infinitely configurable' and fit any purpose. Canopy will always provide a set of dashboards and we will be happy to further customize it for you. Users (depending on their access rights) can also create and edit Dashboards. These dashboards are an implementation of Tableau and therefore quite easy to use (and since there is a large user community, help is easy to find)
Downloading Data from a Dashboard
All data in a dashboard can be downloaded
Creating / Editing Canopy Analytics Dashboards
A short video tutorial is here
Introduction to Strategies (and Creating your own Strategies)
This section is for advanced users.
Private Equity Reporting
This page is still work in progress
, multiple selections available, Use left or right arrow keys to navigate selected items