This document explains methodology of calculation for the Canopy website.
Portfolio > Allocation
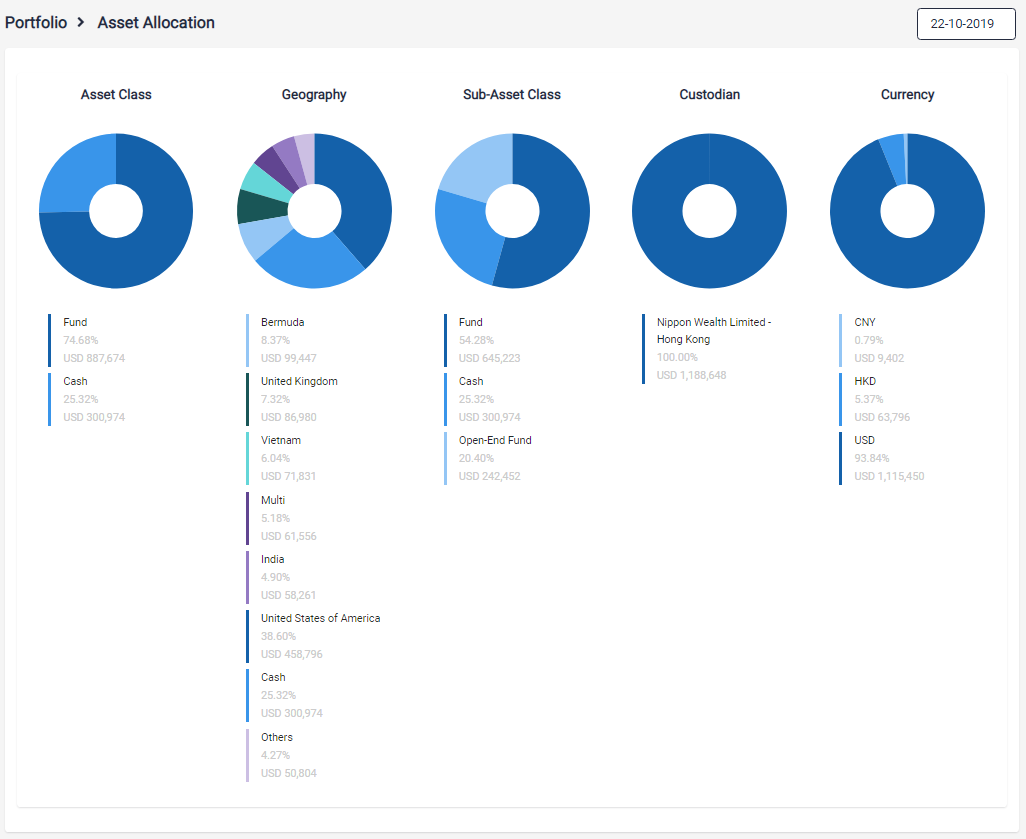
This screen shows the allocation of assets in the portfolio.
This is based on the latest available price for the chosen date. The standard date setting is Today.
All values are converted to base currency of the user.
All percentages in the doughnut charts are relative to the Total Assets, not the Net Worth, as Liabilities are excluded.
Portfolio > Performance
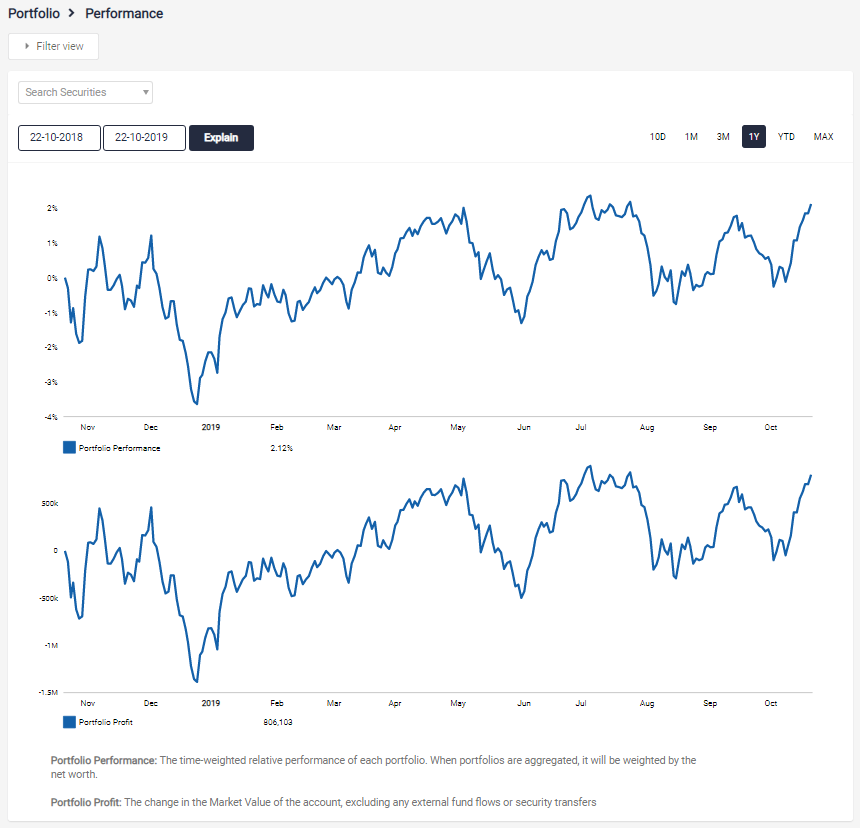
The Performance page shows two charts.
The first chart relates to the relative performance of the portfolio.
This is based on the Net Asset Value (NAV) which is generated for each child account and expresses the performance of the account on a base of 100.
The second chart represents the absolute performance expressed in base currency.
Important Note: Canopy captures the accurate purchase price for any security transactions - also for Security transfers or Opening entries for accounts.
Especially for long-held positions there almost always be a jump in performance.
Canopy behaves in the following ways with regard to security transfers that are at the historical purchase price and therefore off-market for the booking day:
1) Security specific returns:
This captures the original traded price that was used as an input.
Here we will show the full profit of the position, based on the original cost of acquisition.
This provides an overview of the overall profitability of the position and is accessible on the security page and the holdings page.
2) Time-weighted return:
Since this is a very period specific number, it will not be impacted by external transfers.
Because the profit was generated out of period it should not be attributed here and would be misleading.
Canopy, therefore, removes the first-day profit of all transfer trades.
This is applicable to the top chart on the Performance page
3) Absolute return:
This number is a logically a little bit sandwiched between (1) and (2).
On one hand, it can be used for period specific attribution but the overall return of the portfolio is also relevant.
We have decided that this metric is closer to (1) than it is to (2). Meaning, Canopy will show the overall absolute cash number performance of their portfolio and holdings.
For this reason, the absolute return will be impacted by transfers - this may show spikes in the absolute performance chart which are not present in the (relative) time weighted performance chart.
This is applicable to the bottom chart on the Performance page
Portfolio > Holdings
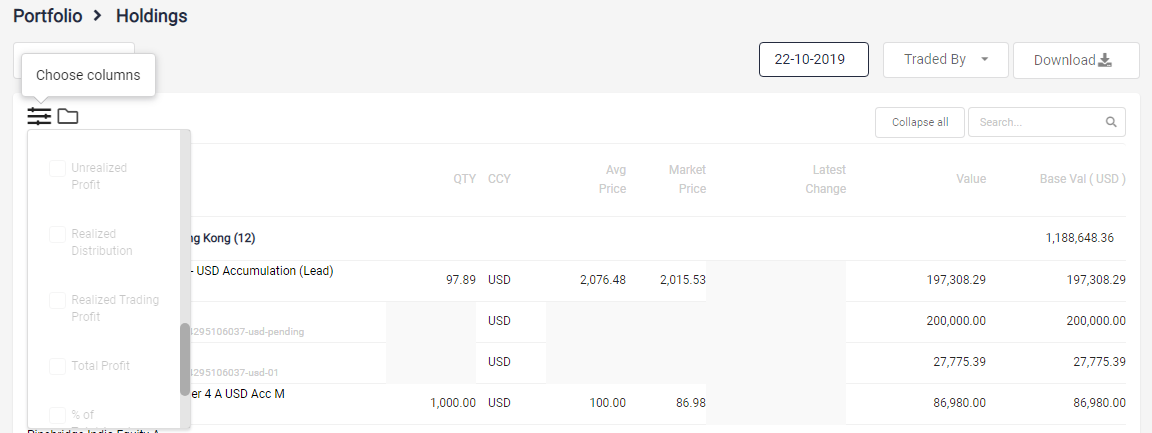
This part explains some of the columns available under Holdings. Click on the column selector icon to select the different columns available for display.
Base Value
Base Value is related to the term Base Currency, which is used for accounting purposes to refer to the currency in which an investor maintains his accounting book. Base Value is the value of your holdings in your base currency.
Unrealized Profit
Profit or loss from market price movement in an open position.
Realized Distribution
This includes all payments from the security, like Coupons or Dividends. Any Contributions paid (that are not purchases) are also accounted for.
Realized Trading Profit
Profit or loss resulting from partial or full close from market price movement in an open position.
Total Profit
The summation of Unrealized Profit, Realized Distribution and Realized Trading Profit
Security Screen
Access the Security Screen via the search box on the top right hand corner of the screen or click on any one of the securities under Holdings page.
The Realized Trading Profit and Distributions here include previously fully closed positions so the historical profit or loss on a security can be tracked.


