/
Reports
Reports
Canopy also offers automated generation of customized PDF reports. The report generator can be found under Reports > Generate Reports.
Fill in the report name and your user account to commence.
Below is a list of the report types that are currently available:
Report Title | Description | Contents | Sample |
|---|---|---|---|
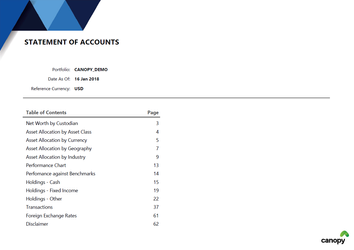
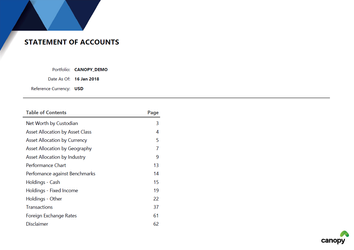
| Portfolio Summary with Transactions - Bar Charts | The Portfolio Summary includes asset allocation, performance, holdings and transactions. Asset allocations and holdings are based on the"Report Date As Of"while performance and transactions are based on respective input parameters"Performance Date From/To" and"Transactions Date From/To". |
| |
| Portfolio Summary with Charts | The Portfolio Summary includes asset allocation, performance, holdings (detailed) and movers char. Asset allocations and holdings are based on the"Report Date As Of"while performance is based on respective input parameters"Performance Date From/To" and"Transactions Date From/To". |
| |
| Portfolio Summary with Transactions - Doughnut Charts | The Portfolio Summary includes asset allocation, performance, holdings and transactions. Asset allocations and holdings are based on the"Report Date As Of"while performance and transactions are based on respective input parameters"Performance Date From/To" and"Transactions Date From/To". |
| |
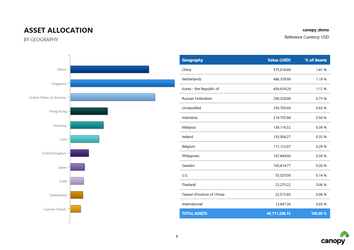
| Asset Allocation - Bar Charts | The Asset Allocation report is based on the"Report Date As Of" and shows asset allocation by asset class, currency, geography, industry as well as networth by custodian. |
| |
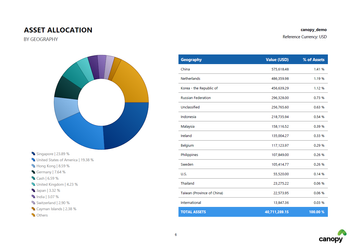
| Asset Allocation - Doughnut Charts | The Asset Allocation report is based on the"Report Date As Of" and shows asset allocation by asset class, currency, geography, industry as well as networth by custodian. |
| |
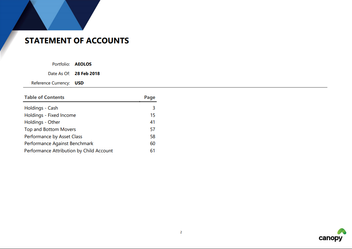
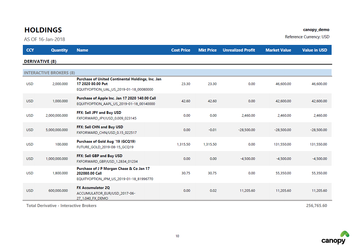
| Portfolio Holdings | The Portfolio Holdings report is based on the"Report Date As Of" shows all holdings organized by currency and asset class. |
| |
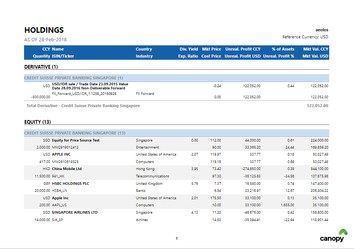
| Portfolio Holdings detailed | The Portfolio Holdings report is based on the"Report Date As Of" shows all holdings organized by currency and asset class, ticker and industry, country and seniority |
| |
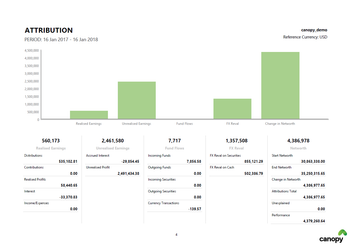
| Performance Attribution | The Performance Attribution report is based on the respective input parameters"Performance Date From/To" shows the performance of the overall account together with performance attribution similar to the Explainer in the Canopy Visualizer. |
| |
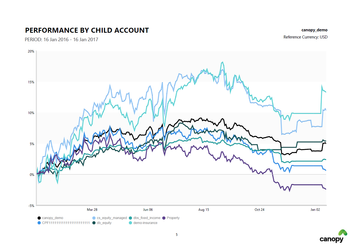
| Performance | Performance is based on the respective input parameters"Performance Date From/To" shows the performance of the overall account in comparison to selected benchmarks and by child accounts and asset classes. |
| |
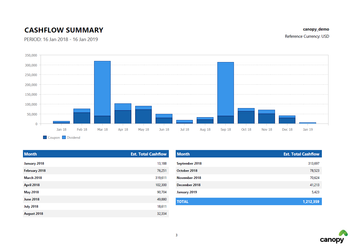
| Cashflows | The Cashflows report is based on the respective input parameters"Cashflows From/To".It shows a summary for all cashflows during the selected period divided into cashflow types on a monthly basis. It also includes a full list of all cashflows organized by type and currency. |
|
, multiple selections available,
Related content
Canopy Reports
Canopy Reports
More like this
Reports offered by the Canopy Financial Statements Module
Reports offered by the Canopy Financial Statements Module
More like this
Canopy Analytics
Canopy Analytics
More like this
Canopy Excel Add-in
Canopy Excel Add-in
More like this
Canopy Visualizer
Canopy Visualizer
More like this
Canopy Manager Module
Canopy Manager Module
More like this
